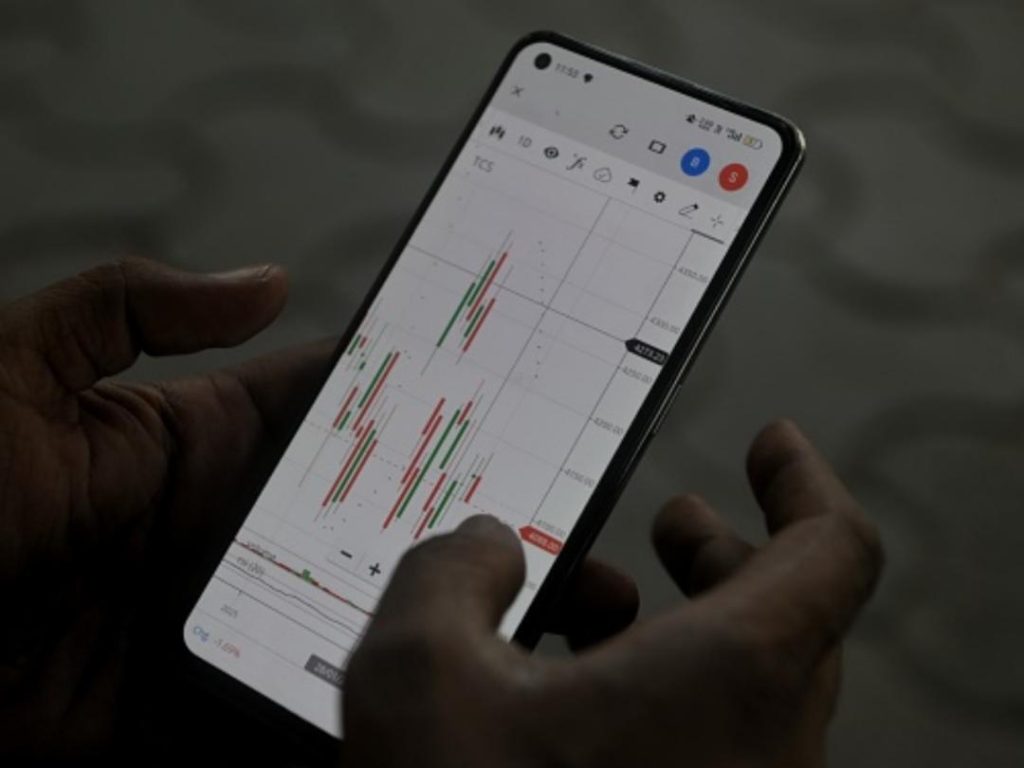
Expiry Day Volatility Seen as Nifty Remains Rangebound: Analysts
The Indian stock market has been experiencing a rollercoaster ride lately, and on Wednesday, the Nifty 50 index managed to snap a three-day losing streak, ending marginally higher. Although the rebound was a welcome change, it did little to alter the broader technical picture as the index remains within a tight range of 24,500 to 25,200. Analysts are now cautioning investors to watch out for potential volatility on expiry day, which is expected to be a crucial day for the market.
The Nifty 50 index, which is widely considered to be the benchmark for the Indian stock market, has been oscillating within a narrow range for quite some time now. The index has been unable to break out of this range, which has led to a lack of direction and clarity in the market. This is a cause of concern for investors, as it can lead to uncertainty and make it difficult to make informed investment decisions.
One of the main reasons for the Nifty’s range-bound movement is the lack of clear direction on the economic front. The Indian economy has been experiencing a slowdown in recent times, and there is no clear sign of a turnaround yet. This has led to a lack of confidence among investors, which has resulted in a lack of direction in the market.
Another reason for the Nifty’s range-bound movement is the lack of participation from institutional investors. Institutional investors, such as foreign portfolio investors (FPIs) and domestic institutional investors (DIIs), play a crucial role in the Indian stock market. They are the ones who provide liquidity to the market and help to drive the market’s direction. However, in recent times, institutional investors have been relatively inactive, which has led to a lack of participation in the market.
Despite the Nifty’s range-bound movement, analysts are expecting volatility on expiry day. Expiry day is a crucial day for the Indian stock market, as it is the day when all open positions in futures and options contracts are settled. This can lead to a sudden surge in trading volume and volatility, as investors try to adjust their positions and hedge against potential risks.
Analysts are advising investors to watch out for a breakout on expiry day. A breakout is a sudden surge in the market that can lead to a significant change in the market’s direction. If the Nifty breaks out of its current range, it can lead to a significant rally or correction, depending on the direction of the breakout.
In addition to watching out for a breakout, analysts are also advising investors to keep a close eye on the market’s technical indicators. These indicators can help to provide a better understanding of the market’s direction and momentum. Some of the key technical indicators that investors should be watching include the relative strength index (RSI), the moving average convergence divergence (MACD), and the Bollinger bands.
The RSI is a momentum indicator that can help to provide a better understanding of the market’s momentum. It measures the speed and change of a stock’s price movement over a given period of time. If the RSI is above 70, it can indicate that the market is overbought and due for a correction. On the other hand, if the RSI is below 30, it can indicate that the market is oversold and due for a rally.
The MACD is a trend-following indicator that can help to provide a better understanding of the market’s trend. It measures the difference between two moving averages and can help to identify the direction and strength of a trend. If the MACD is above the signal line, it can indicate that the market is in an uptrend. On the other hand, if the MACD is below the signal line, it can indicate that the market is in a downtrend.
The Bollinger bands are a volatility indicator that can help to provide a better understanding of the market’s volatility. They consist of three lines: a moving average, a lower band, and an upper band. If the market price is below the lower band, it can indicate that the market is oversold and due for a rally. On the other hand, if the market price is above the upper band, it can indicate that the market is overbought and due for a correction.
In conclusion, the Nifty 50 index is expected to remain range-bound in the short term, with analysts advising investors to watch out for a breakout on expiry day. Investors should also keep a close eye on the market’s technical indicators, such as the RSI, MACD, and Bollinger bands, to get a better understanding of the market’s direction and momentum. By doing so, investors can make informed investment decisions and navigate the market’s volatility with ease.


